In 2026, the subscription offer market (Subscription / CC-Submit) in Sweepstakes (raffles, electronics) and Dating (adult and mainstream) is undergoing a massive technological transformation. The era of “blind” buying—where media buyers or advertisers relied solely on the high conversion rate of the initial trial ($1–$2 CC-Submit)—is officially behind us.
Today, the main goal for any media buyer or subscription product owner is not just getting the first card entry, but predicting user Lifetime Value (LTV) and minimizing the Churn Rate before financial losses become critical.
If your user unsubscribes within the first 24–48 hours or their payment card yields a Soft/Hard Decline on the very first rebill attempt, your ROI instantly plunges deep into negative territory.
In this article, we will detail how to build and deploy a machine learning (ML) model capable of predicting user churn in Sweepstakes and Dating with 85–92% accuracy hours (or even minutes) before the first rebill, and how to use this data to proactively rescue conversions.
Part 1. The Anatomy of Churn in Sweepstakes & Dating Subscriptions
To build an effective ML model, you must clearly distinguish between the two fundamental types of churn that subscription services face:
                          [Types of Churn Rate]
                                    │
        ┌───────────────────────────┴───────────────────────────┐
        ▼                                                       ▼
 Voluntary Churn                                         Involuntary Churn
(User manually cancels subscription)               (Transaction failure / Soft Decline)
- Voluntary Churn: The user deliberately enters their account settings or contacts support to cancel auto-renewal. In Dating, this often happens due to a lack of immediate results or realizing they entered a subscription model. In Sweepstakes, it stems from “epiphany” right after the initial transaction.
- Involuntary Churn: The user did not cancel, but the acquiring bank failed to charge the card for the next period. Reasons include insufficient funds, issuer bank anti-fraud blocks, card expiration, or payment gateway glitches.
Churn Math and LTV
The Churn Rate over period $T$ is calculated using the classic formula:
$$Churn\ Rate = \frac{N_{lost}}{N_{start}} \times 100\%$$
Where $N_{lost}$ is the number of users who canceled or failed a rebill during period $T$, and $N_{start}$ is the total number of active subscribers at the start of the period.
To forecast LTV in subscription funnels, we use the relationship between the average rebill value ($ARPU$) and the churn rate:
$$LTV = \frac{ARPU \times Margin}{Churn\ Rate}$$
Even a slight reduction in Churn Rate (for instance, from 35% to 25%) driven by ML algorithms yields an exponential boost in LTV, allowing media buyers to bid higher (CPA/CPC) in ad networks and outcompete rivals in auctions.
Part 2. Feature Engineering for the ML Model
An ML algorithm’s output quality is 80% dependent on the input features provided. In affiliate funnels and subscription products, feature vectors are compiled within the first milliseconds of a user’s visit.
1. Behavioral Features
- Time from click to initial card entry: Suspiciously fast entry (under 5 seconds) often signals browser autofill or script bots. Exceptionally slow entry (over 3 minutes) indicates user hesitation.
- Interaction depth on the prelander: Number of spins on a Fortune Wheel (Sweepstakes) or number of profiles/chat messages browsed (Dating).
- Activity within the first 3 hours post-registration: Number of logins, profile completions, or avatar uploads (for Dating).
2. Technical & GEO Features
- IP Quality and ISP: Mobile 4G/5G IP vs. residential Wi-Fi vs. Residential Proxy.
- Device Type and OS: An $80 budget Android vs. a flagship iPhone. Statistics show that retention on iOS in the Dating vertical is, on average, 18–25% higher.
- User-Agent & Browser Fingerprint: Unique browser signatures, language settings, and IP-to-timezone matching.
3. Financial Features
- Card BIN (Bank Identification Number): A critical vector! Card type (Credit vs. Debit vs. Prepaid/Virtual). Virtual and prepaid cards in Sweepstakes yield up to 80% Churn Rate on the very first rebill.
- Issuer Bank: Certain local banks automatically block recurring micro-transactions from foreign acquiring gateways.
- 3D-Secure Pass Rate (if applicable): Successful verification on the first attempt vs. repeated attempts.
Part 3. Churn Rate Prediction Model Architecture
Predicting churn is framed as a binary classification task (user churns: $1$, user stays: $0$) or estimating the probability of churn $P(Churn) \in [0, 1]$.
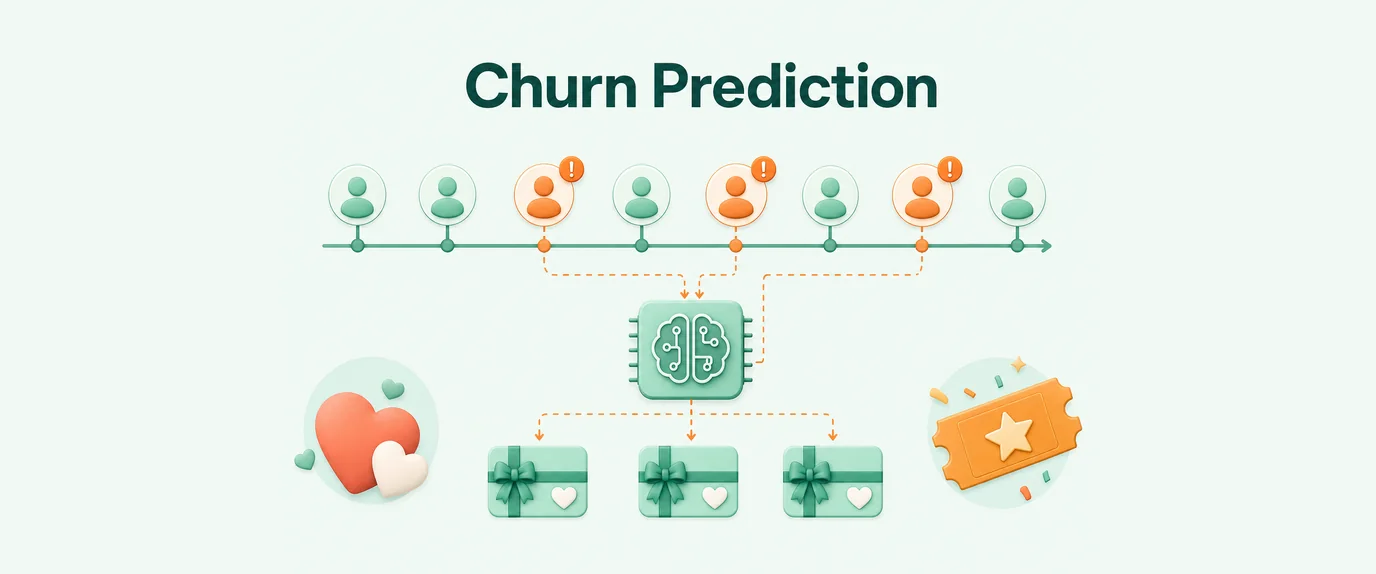
[User Traffic Flow]
         │
         ▼
[Feature Collection: Behavior + Specs + BIN]
         │
         ▼
[ML Model: Gradient Boosting (LightGBM/CatBoost)]
         │
         ├── P(Churn) > 0.75 ──► [High Risk Group] ──► Downsell / Discount / Gateway Swap
         │
         └── P(Churn) < 0.25 ──► [Standard Funnel] ──► Normal Rebill Cycle
Algorithm Selection
In AdTech and fintech, Gradient Boosted Decision Trees (GBDT) deliver the highest performance:
- CatBoost: Ideal for tabular data with many categorical features (GEO, ISP, Card BIN, device model, offer type). Works out of the box without complex preprocessing (One-Hot Encoding).
- LightGBM: The choice for high-throughput systems processing heavy traffic. Delivers blazing-fast inference speeds—under a few milliseconds per request.
- Neural Networks (LSTM / Transformers): Used in major Dating platforms for analyzing time-series data of user activity over 7–14 days.
Part 4. Step-by-Step Python ML Model Implementation
Below is a conceptual Python code snippet using the CatBoost library, demonstrating how to train a churn prediction model on collected data:
import pandas as pd
from catboost import CatBoostClassifier, Pool
from sklearn.model_selection import train_test_split
from sklearn.metrics import roc_auc_score, classification_report

# 1. Load the prepared dataset
# Contains session features and target label 'is_churn' (1 - unsubscribed/rebill failed, 0 - renewed)
data = pd.read_csv('subscription_churn_dataset.csv')

# Define categorical features
categorical_features = ['geo', 'device_brand', 'os', 'connection_type', 'card_type', 'bin_code']

# Fill missing values in categorical features
for col in categorical_features:
    data[col] = data[col].fillna('UNKNOWN')

# Split into features (X) and target variable (y)
X = data.drop(columns=['user_id', 'is_churn'])
y = data['is_churn']

# Train/Test split
X_train, X_test, y_train, y_test = train_test_split(X, y, test_size=0.2, random_state=42, stratify=y)

# 2. Create CatBoost data pool
train_pool = Pool(X_train, y_train, cat_features=categorical_features)
test_pool = Pool(X_test, y_test, cat_features=categorical_features)

# 3. Initialize and train the model
model = CatBoostClassifier(
    iterations=1000,
    learning_rate=0.05,
    depth=6,
    loss_function='Logloss',
    eval_metric='AUC',
    random_seed=42,
    verbose=100
)

model.fit(train_pool, eval_set=test_pool, early_stopping_rounds=50)

# 4. Evaluate model performance
preds_proba = model.predict_proba(test_pool)[:, 1]
auc_score = roc_auc_score(y_test, preds_proba)

print(f"\n[Success] Model trained. ROC-AUC Score: {auc_score:.4f}")

# 5. Save the model for production inference
model.save_model('churn_predict_model.cbm')
Part 5. Automated Actions Driven by ML Predictions
The true value of an ML model lies not in prediction alone, but in automated workflows triggered when risk reaches a critical threshold $P(Churn)$.
Scenario 1: Dynamic Downsell (Preventing Voluntary Churn)
If the model indicates an 80% probability that a Sweepstakes or Dating user will cancel within 24 hours:
- UI Trigger: When the user clicks “Cancel Subscription” (or attempts to close the tab), the system launches a dynamic split.
- Retention Offer: The user is offered a 50% discount on the next month, 7 days of free VIP access, or a cheaper micro-plan (Downsell). This saves up to 30% of churning traffic.
Scenario 2: Smart Payment Cascading (Preventing Involuntary Churn)
To prevent payment failures (Soft Decline), the ML model feeds risk scores into a payment router (Cascading Gateway):
- High-Risk Cards (Prepaid/Virtual): Rebill charges are initialized not at standard hour “X,” but at optimal times (e.g., payday dates or hours when bank anti-fraud systems experience lower load).
- Acquirer Swapping: The transaction is routed to an alternative payment gateway with looser fraud monitoring for that specific GEO or card type.
Part 6. Comparative Analysis: Traditional Approach vs. ML Approach
| Parameter | Traditional Approach (Static Rules) | ML Prediction (Predictive) |
| Churn Detection Accuracy | Low (30–45%), purely reactive post-cancellation | High (80–92%), proactive prediction pre-rebill |
| Behavioral Responsiveness | Static timers and rigid scripts | Dynamic real-time session analysis |
| Payment Card Handling | Identical billing sequence for all cards | Smart routing based on BIN and risk prediction |
| Average LTV Lift | Baseline | +25% to +45% LTV growth |
| Impact on Churn Rate | Forced loss acceptance | Preventive churn reduction by 15–20% |
Part 7. ML Churn Prediction Implementation Checklist
If you plan to integrate predictive churn analytics into your subscription funnel, follow this step-by-step roadmap:
- [ ] Collect Historical Data: Accumulate a dataset of at least 10,000–50,000 transactions with labeled outcomes (successful rebill / cancellation / decline).
- [ ] Configure S2S Logging: Ensure your tracker and CRM log all session parameters (IP, User-Agent, Card BIN, behavioral triggers).
- [ ] Train a Baseline Model: Train a simple model (e.g., CatBoost or Logistic Regression) and verify the ROC-AUC score (target $> 0.80$).
- [ ] API Integration: Deploy the ML model as a microservice (e.g., via FastAPI / Docker) with response latency $< 50\text{ ms}$.
- [ ] Launch Automated Workflows: Set up automated Downsell triggers and smart payment cascading for high-risk segments.
- [ ] Run A/B Tests: Compare Churn Rate and LTV metrics between the control group (no ML) and the test group (ML-optimized).
Conclusion
Predicting user Churn Rate in Sweepstakes and Dating subscription offers using machine learning is no longer a luxury—it is an essential performance standard in 2026 AdTech.
Moving from passive churn tracking to predictive LTV management empowers media buyers and product owners to maintain sustainable ROI, win top traffic volumes in ad auctions, and safeguard payment infrastructure against high chargeback and decline rates.