
Cohort analysis in arbitrage and performance marketing: how to stop looking only at clicks and start seeing LTV
Why arbitrage and performance marketing need cohort analysis
The classic approach in traffic arbitrage:
- we look at the cost per click (CPC), cost per lead/deposit (CPA),
- calculate ROI/ROAS on fresh traffic,
- cut sources and creatives based on top-level metrics.
The problem: the money often doesn’t come on day one.
Especially in niches like:
- gambling / betting – getting users to the 2nd+ deposit;
- subscriptions / apps – renewals, upsells;
- SaaS and B2B services – recurring payments;
- e-commerce – repeat purchases.
A lead looks “expensive” on the first deposit, but after 30–90 days it might pay back 2–3x. If you kill setups based only on short-term ROI, you’re cutting off your own scale.
Cohort analysis is exactly about this: grouping users into cohorts and tracking how they pay over time so you can see:
- real LTV by sources / creatives;
- payback not only on day 0, but also at 7/30/60/90-day horizons;
- “long” setups that look like trash by click metrics, but bring cash in the long run.
What is a cohort in simple terms
A cohort is a group of users who share the same “start” attribute.
Most often in arbitrage and performance marketing a cohort = users who:
- performed their first target action in the same period (day / week / month);
and/or:
- came from the same source / campaign / creative;
- belong to the same geo, platform, device type, etc.
Examples of cohorts:
- all users who made their first deposit between 1–7 November from Facebook campaign X, geo DE;
- all installs from TikTok campaign Y in October, iOS platform;
- all registrations from teaser network Z for a week, segment “mobile/Android/BR”.
The key difference: “click analysis” vs “cohort LTV analysis”
If you look only at clicks / day 1
You see:
- CTR,
- CPC,
- CR (registration/deposit),
- CPA,
- ROI/ROAS on the launch day.
And you conclude: “the campaign is in the red, cut it.”
If you look at cohorts by LTV
You take, for example, a cohort of users who made their first deposit in October:
- see how much they brought on days 0, 7, 30, 60, 90;
- compare that with the costs for the same cohort;
- calculate not only “today’s” ROI, but cumulative ROI.
Suddenly it turns out:
- Day 0: ROI −30%
- Day 30: ROI +15%
- Day 90: ROI +70%
This setup, in a “click-thinking” mindset, would look like a loss. In cohort analysis, it’s a gold mine — just with a long payback tail.
How to choose a cohort axis in arbitrage and performance marketing
Usually there are two dimensions:
- Time axis (start point)
- date of first click,
- date of registration,
- date of first deposit / first purchase,
- date of app install.
- Segmentation axis (who they are)
- traffic source (FB, TikTok, Google Ads, DSP, push, etc.),
- specific campaign / ad set / creative,
- geo, language,
- device (iOS/Android, mobile/desktop),
- type of landing, funnel (with/without pre-lander, quiz / direct offer).
The most practical option for arbitrage
Cohort = (date of first deposit/purchase) × (campaign/creative)
This way you:
- detach from random registrations that never deposit;
- compare only people who have already brought money;
- see which campaigns drive more repeat payments and upsells.
Which metrics to look at in cohort analysis
1. LTV (Lifetime Value)
LTV is calculated as the total revenue from a user or group over a period.
- LTV D0 — revenue on the day of the first action (deposit, purchase).
- LTV D7 — cumulative revenue over 7 days.
- LTV D30, D60, D90 — and so on.
For a cohort:
LTV_cohort_D30 = (total revenue from the cohort over 30 days) / (number of users in the cohort)
2. CAC / CPA (Cost per Acquisition)
How much it cost to bring a user who became part of the cohort:
- CAC per deposit,
- CAC per purchase,
- CAC per install (if you monetize further inside the app).
3. Cohort ROI / ROAS
ROI_D30 = (cohort revenue over 30 days − traffic cost for this cohort) / traffic cost × 100%
ROAS_D30 = cohort revenue over 30 days / traffic cost × 100%
Calculated for different horizons: D0, D7, D30, D90.
4. Retention and repeat actions
Especially important for gambling, apps, subscriptions:
- share of users who reach the second deposit,
- average number of deposits/purchases per user,
- retention D1/D7/D30 (user activity).
A simple “back-of-the-envelope” cohort analysis example
Let’s say you’re driving traffic to a gambling offer.
Campaign A (Facebook)
- 100 deposits in October
- CAC = $25
- Spend = $2,500
Campaign B (TikTok)
- 100 deposits in October
- CAC = $25
- Spend = $2,500
By the first deposit (day 0):
- A: average deposit $25 → revenue = $2,500 → ROI D0 = 0%
- B: average deposit $20 → revenue = $2,000 → ROI D0 = −20%
If you look only at D0 — it’s logical to kill campaign B.
Now look at cohorts and LTV:
On day 30:
- A: LTV D30 = $35 → revenue = $3,500 → ROI D30 = (3,500−2,500)/2,500 = +40%
- B: LTV D30 = $50 → revenue = $5,000 → ROI D30 = (5,000−2,500)/2,500 = +100%
Conclusion:
The Facebook campaign A works okay, but TikTok campaign B is even more profitable in the long run — its users just warm up slower and bring more repeat deposits.
Without cohort analysis you would have turned it off.
Where and how to collect data for cohort analysis
Data sources
- Tracker / analytics (Keitaro, Binom, Voluum, RedTrack, Bemob, etc.)
- clicks, visits, partner postbacks, spend;
- you can pass values (deposits, amounts) and build reports.
- CRM / billing / affiliate stats
- real deposits, amounts, native LTV;
- user statuses.
- BI tools and spreadsheets
- Google Sheets / Excel,
- Power BI, Tableau, Metabase, Looker Studio, Redash, etc.
Common flow:
- Tracker → export clicks/campaigns/spend.
- Affiliate program/CRM → export user-level data (ID, deposit dates, amounts).
- Join by user_id / click_id / sub_id → master table.
- On top of that — cohort reports.
How to build a cohort report (basic flow)
- Define what the cohort “start” is.
For example: date of first deposit. - Create a user table with fields:
- user_id,
- date of first deposit (cohort_date),
- source / campaign / creative,
- acquisition cost (you can use average CAC if you can’t match it exactly),
- all subsequent transactions with dates and amounts (can be a separate table).
- Calculate LTV by days
For each user:- Day 0 revenue — all transactions on the day of first deposit;
- Day 1 revenue — next day, and so on;
- or directly calculate cumulative LTV by periods (D7, D30, D60).
- Group by cohort
For example, by month of first deposit and campaign:- Cohort = (month(first_deposit_date), campaign_id)
- Sum revenue by days from all users in the cohort;
- Divide by number of users → LTV by days/weeks.
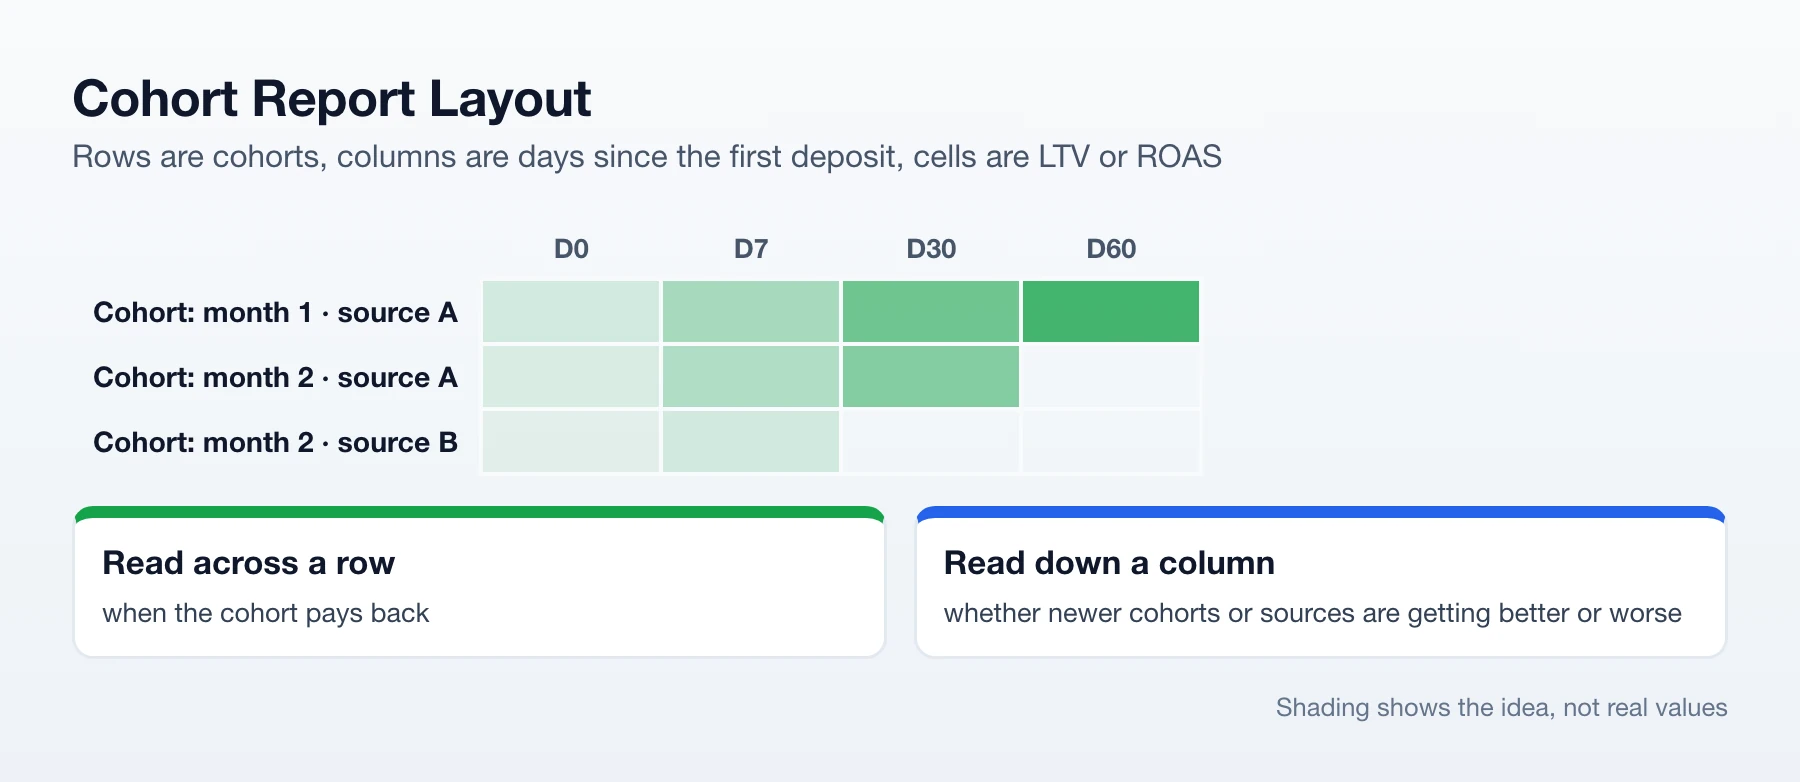
- Build a cohort “heat map”
Often it’s a table:- rows — cohorts (e.g. months),
- columns — days since start (D0, D7, D30, D60),
- values — LTV or ROAS / ROI.
This table shows:
- which cohorts (months, sources) are degrading or growing;
- after how many days traffic pays back on average;
- how traffic quality changes after product/flow changes (new landers, pre-landers, creatives).
How to use cohort analysis results in practice
1. Planning acceptable CPA / CAC
Knowing that:
- average LTV D30 = $80,
- you want ROI D30 = 30%,
you can calculate target CAC:
CAC_target = LTV_D30 / (1 + ROI_target) = 80 / 1.3 ≈ 61.5$
This means that even CAC $50–60 can be totally fine if long-term LTV is high, and you shouldn’t panic over “expensive” deposits in the moment.
2. Determining the payback period
With cohorts you can see:
- after how many days each cohort breaks even (payback period);
- how fast and how far LTV “catches up”.
This matters if you buy traffic on credit, use borrowed money, or work with investors.
3. Prioritizing sources and creatives
Not all clicks are equally valuable:
- a source with cheap clicks but weak LTV → “junk” traffic;
- a source with expensive clicks but strong LTV → “premium” traffic.
Cohort analysis lets you:
- objectively compare sources and campaigns by LTV and ROI over time;
- bid more aggressively where LTV is high;
- cut where users don’t stick and don’t pay.
4. Testing changes in product / funnel
You change:
- landing / pre-lander;
- bonus mechanics;
- welcome pack (free spins, discounts);
- call center scripts, etc.
You then look at:
- LTV of new cohorts vs old;
- payback periods;
- conversion to second/third payment.
Common mistakes in cohort analysis
- Mixing periods and cohorts.
You can’t compare LTV of users who came in different months as if they were the same group. That’s what cohorts are for. - Focusing only on D0–D1.
The most common arbitrage mistake: turning off “long” setups. - Ignoring traffic costs.
Looking only at LTV isn’t enough — you must calculate cohort ROI/ROAS considering spend. - Over-segmentation.
If you slice cohorts by too many parameters, you end up with 10–20 users per segment — just noise.
Start with:- month (or week) of start,
- source/campaign,
- major geos.
- No link between traffic and revenue.
If you can’t match user_id/subs/clicks between tracker and affiliate/CRM, cohort analysis becomes much less accurate. You need to think about tracking and IDs from day one.
How to implement cohort analysis “the simple way” right now
If you don’t have fancy BI and a data team, you can start with a minimal setup:
- Export from the affiliate program / CRM:
- user_id,
- date of first deposit,
- amount of first deposit,
- amounts of subsequent payments with dates.
- Export from the tracker:
- user_id or click_id / sub_id,
- source, campaign, creative,
- traffic cost by these IDs.
- Join in Google Sheets / Excel by ID.
In the worst case — match “on average” (CAC = spend / number of first deposits per campaign). - Build a simple pivot table:
- rows: month of first deposit × campaign,
- columns: D0, D7, D30, D60 (LTV, ROAS),
- a separate table with cumulative ROI.
- Based on these numbers:
- recalculate acceptable CAC,
- understand which campaigns to scale and which really don’t perform.
Conclusion
Cohort analysis in arbitrage and performance marketing is a shift:
- from “click-thinking” (CTR, CPC, CPA, ROI on launch day)
- to “money-over-time thinking” (LTV, cohort ROAS/ROI, payback period).
It allows you to:
- avoid killing profitable setups because of weak day-one metrics;
- more accurately plan bids, budgets, and acceptable CAC;
- understand the real quality of traffic, not just its price;
- scale arbitrage and performance channels systematically instead of living “from creative to creative”.
In short: cohort analysis is a way to see the true value of your traffic, not just its cost.
| Horizon | Campaign A (Facebook) ROI | Campaign B (TikTok) ROI | Click-Thinking Verdict | Cohort Verdict |
|---|---|---|---|---|
| Day 0 | 0% | −20% | Kill Campaign B immediately | Too early to judge |
| Day 30 | +40% | +100% | — | Campaign B is the real winner |
Looking only at day-one clicks and CPA would have led straight to cutting Campaign B — its early ROI looked worse than Campaign A’s. But as the table above shows, tracking the same users forward to day 30 flips the conclusion entirely: Campaign B’s slower-to-convert traffic ends up delivering more than double the return. This is the core argument for cohort analysis — short-term metrics measure how traffic looks on arrival, not what it’s actually worth. In niches with second deposits, renewals, or repeat purchases, judging a source by day 0 or day 1 numbers alone means routinely killing the setups that would have scaled best, while campaigns that look “cheap” up front can quietly be the ones draining budget with no long tail behind them. Building even a basic LTV-by-cohort report — grouped by month of first deposit and campaign, tracked at D0/D7/D30/D60 — turns arbitrage from a game of reacting to launch-day numbers into one of allocating budget toward proven, long-run payback
FAQ
1. What’s the practical difference between click analysis and cohort LTV analysis?
Click analysis judges a campaign by day-one numbers — CTR, CPC, CPA, and ROI on the launch day — and cuts anything that looks unprofitable at that snapshot. Cohort analysis instead groups users by a shared start point (like date of first deposit) and tracks how much that same group pays back over 7, 30, 60, and 90 days, which can completely reverse the initial verdict on a source or creative.
2. What’s the most practical way to define a cohort for arbitrage traffic?
The most useful combination is cohort = date of first deposit or purchase × campaign/creative. This detaches the analysis from random registrations that never convert and lets you compare only users who already generated revenue, showing which campaigns actually drive repeat payments and upsells rather than just cheap signups.
3. How do you calculate the CAC you can actually afford to pay?
Once you know a cohort’s LTV at a given horizon and your target ROI, target CAC = LTV_D30 / (1 + ROI_target). For example, an LTV D30 of $80 with a 30% target ROI gives a target CAC of roughly $61.5 — meaning a $50–60 CAC that looks expensive on day one can be entirely sustainable once the full payback window is accounted for.
4. What are the most common mistakes teams make when trying to run cohort analysis?
The biggest ones are mixing users from different periods into one comparison instead of proper cohorts, judging performance only on D0–D1 and cutting “long” setups too early, ignoring traffic cost and looking at raw LTV alone, slicing cohorts by too many parameters until segments shrink to statistical noise, and failing to link user_id or click_id between the tracker and the CRM/affiliate data, which undermines accuracy from the start.
5. What’s the minimum setup needed to start cohort analysis without a dedicated BI team?
Export user-level data from your affiliate program or CRM (user_id, first deposit date and amount, subsequent payment dates and amounts), export cost data from your tracker (user_id or click_id, source/campaign/creative, spend), join them by ID in Google Sheets or Excel — using average CAC per campaign if exact matching isn’t possible — then build a pivot table with cohorts as rows and D0/D7/D30/D60 as columns to see LTV and ROAS develop over time