
Advertising fraud is any artificial impressions, clicks, installs, or conversions that look like real performance but don’t bring you real users or sales.

For an advertiser, that means:
- Wasted budget
- Inflated CPA / CPI / CPL
- Broken analytics – it gets hard to understand what really works
Fraud rarely looks like something obviously evil. Much more often it’s hidden in patterns: strange CTR, “too perfect” conversions, abnormal time-to-conversion, suspicious IPs and devices.
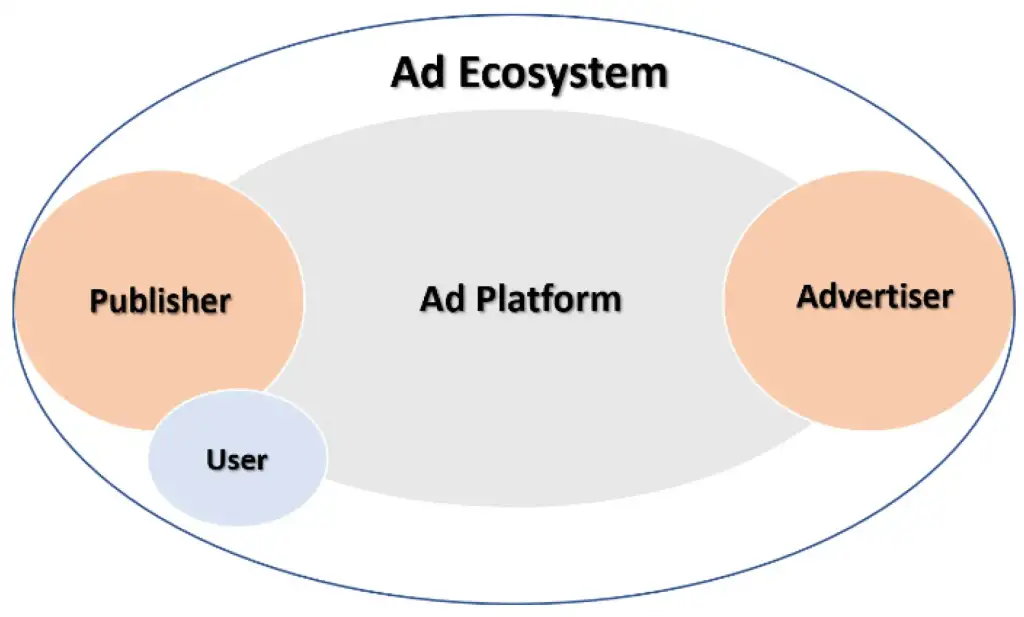
In this article we’ll look at anti-fraud from the advertiser’s point of view:
- What signals to look for in your stats
- Which fraud patterns are the most common (suspicious CTR, abnormal time-to-conversion, proxy / bots)
- How a typical ad network anti-fraud system works
1. Key Metrics and Basic Formulas
First, let’s align on the main performance metrics and how to calculate them.
CTR (Click-Through Rate, %) = (Clicks / Impressions) × 100

CR (Conversion Rate, %) = (Conversions / Clicks) × 100

eCPC (effective CPC) = Spend / Clicks

eCPA (effective CPA / CPI / CPL) = Spend / Conversions
For time-to-conversion we usually look at distributions:
Median TTC = median(Time from click to conversion)

P90 TTC = 90th percentile of Time to conversion
In practice you don’t need super complex math. The main idea is:
- Compare metrics across placements / sources to find anomalies
- Compare them to your own historical baseline (your past campaigns)
2. Suspicious CTR: When a “Good” Metric Becomes a Warning Sign
CTR (Click-Through Rate) is one of the easiest places where fraud shows up.
2.1. Formula for CTR
CTR (%) = (Clicks / Impressions) × 100
2.2. What’s “normal” and what looks suspicious
“Normal” CTR depends on vertical, format, and traffic source, but you can use these rules of thumb:
- Display / banner ads: 0.3–3%
- Native / feed ads: 1–5%
- Push / in-app rich formats: 2–10%
Instead of absolute values, look at anomalies relative to your averages.
Heuristic thresholds (per placement / site / source):
- CTR > 3× campaign average and
- CR is low (CR < 0.3× campaign average), or
- eCPA is much higher (eCPA > 1.5–2× campaign average)
- Sudden CTR spikes by >100–200% in a short time (same creatives, same bids)
If CTR is abnormally high but users do not convert or behave like real humans, this is a strong fraud signal (click-spam, auto-clicks, incentivized clicks, etc.).
3. Abnormal Time-to-Conversion (TTC)
Time-to-conversion (TTC) is the lag between click and target action (install, signup, purchase, lead, etc.).
3.1. Key TTC metrics
TTC for each conversion = Conversion time – Click time

Median TTC = median(TTC across conversions)

P90 TTC = value where 90% of conversions happen faster
3.2. What looks realistic
- Mobile app install: usually seconds to a few minutes
- Simple signup / short form: 30 seconds – 5 minutes
- Complex form / loan / big order: 2–10 minutes or even longer
The exact numbers depend on your funnel, but even without exact benchmarks you can see abnormal patterns.
3.3. Suspicious TTC patterns and thresholds
Pattern 1: Instant conversions
- Complex action (loan lead, long signup, multi-step funnel)
- Large share of conversions happens in 0–3 seconds after the click
Heuristic threshold:
- For actions that normally take >30–60 seconds: if ≥10–20% of conversions have TTC ≤3 seconds, that’s a red flag.
Pattern 2: “Perfectly even” TTC distribution
- Conversions come in a flat, mechanical pattern (e.g., exactly 5 conversions every 10 minutes)
- No daily cycles (morning vs night, weekdays vs weekends)
Real users convert in waves, not like a metronome.
Pattern 3: Too many ultra-fast “perfect” conversions
- Most users complete a complex form in 5–15 seconds
- Many fields look random or identical
This is typical of automated form filling and script-based conversions.
4. On-Site / In-App Behavior: How Real Users Differ from Bots
Even if your network doesn’t give behavior stats, you can track them via analytics tools (GA4, Appsflyer, Firebase, etc.).
Behavioral red flags per source / placement:
- Average time on site < 3–5 seconds with a lot of clicks
- Pages per session ≈ 1 while normal traffic shows 2–4 pages
- Bounce rate > 80–90% for that source
- Almost no interactions:
- Few scrolls
- Few clicks on buttons / links
- No meaningful events triggered
- Zero or extremely low returning users / retention from that source
Fraud logic is simple: the bot comes, triggers whatever needs to be fired (pixel, script, event), then leaves with no real behavior.
5. Technical Signals: IPs, Devices, Proxy / VPN

Technical parameters (IP, user-agent, device type, OS, geo) are extremely useful for detecting fraud.
5.1. What to monitor
- IP and subnets
- Unusually high number of clicks / conversions from the same IP or narrow subnet (e.g. /24)
- Large share of traffic from data-center / hosting IPs (not residential ISPs)
- User-Agent & device
- Very large share of traffic with one identical user-agent string
- Unrealistic or outdated browsers / OS versions that you almost never see in your good traffic
- Geo
- Geo that doesn’t match your targeting but still “converts”
- Geo that jumps around while IP ranges and devices remain similar
Heuristic thresholds:
- >20–30% of clicks from data-center / hosting IPs for a consumer offer = strong suspicion
- >50% of traffic with the same user-agent on a supposedly diverse campaign = red flag
6. Typical Fraud Patterns (With Numbers)
6.1. Suspiciously high CTR with bad performance
Scenario: Campaign runs for a week. Average CTR = 1.5%. One specific placement shows:
- CTR = 18–20% (that’s 12× higher than the average)
- CR = 0.2% (while campaign average is 1.0–1.5%)
- eCPA is 2–3× higher than your campaign average
Threshold example:
- If for a placement:
- CTR > 3× campaign median, and
- CR < 0.5× campaign median, or
- eCPA > 1.5–2× campaign median
6.2. Abnormal time-to-conversion for a complex offer
Scenario: Offer: loan application with a detailed form. Normal flow (based on your historical data):
- Median TTC = 3 minutes
- P90 TTC = 8–10 minutes
New source appears with:
- Median TTC = 15 seconds
- 30% of conversions have TTC ≤ 5 seconds
- Many leads fail your internal scoring, or data looks random
Heuristic rule:
- If Median TTC < 0.2× your normal median for a complex action, and
- ≥20–30% of conversions have TTC ≤ 5 seconds,
- this traffic should be marked as high-risk and potentially fraudulent.
6.3. Proxy / bot traffic with repeating patterns
Scenario:
- Most clicks come from a narrow set of data-center IP ranges
- 80% of traffic has the same user-agent and screen resolution
- Clicks and conversions arrive in perfectly even batches, e.g., 10 clicks and 1 conversion every 5 minutes, 24/7
Real users don’t behave that way. This is classic scripted or bot traffic.
7. What Advertisers Can Do to Fight Fraud
Anti-fraud is not “the network’s problem only”. Advertisers have their own strong levers of control.
7.1. Tracking design and feedback loop
- Implement proper tracking:
- UTM tags, click IDs, subIDs (sub1–sub5) for placement IDs, source, creative, etc.
- This lets you quickly pinpoint fraudulent sources and placements.
- Send conversion statuses back to the network:
approved / rejected / hold- Reasons: fake data, duplicate, invalid, fraud, etc.
- Use S2S postbacks / API so the network sees not only the raw conversion, but also:
- Was the loan approved?
- Was the order paid?
- Did the user reach key in-app events?
The more feedback the network gets, the better its anti-fraud model becomes for your specific business goals.
7.2. Regular stats review with numeric rules
Define a basic set of reports you check regularly:
- By placement / site ID / app ID
- By geo, device, OS
- By time (hour of day, day of week)
- By source / subIDs
Watch these metrics:
- CTR, CR
- eCPC, eCPA / eCPI
- On-site behavior (time on site, pages per session, bounce rate)
- Down-funnel metrics: approval rate, LTV, retention, ARPU
Example numeric rules you can use:
- CTR rule: placement CTR > 3× campaign median
- AND CR < 0.5× campaign median, OR
- eCPA > 1.5× campaign median → mark as suspicious and review manually.
- TTC rule (complex actions):
- Median TTC < 0.2× historical median, AND
- ≥20–30% conversions with TTC ≤ 5 seconds → high fraud risk.
- Behavior rule:
- Average time on site < 3 seconds, AND
- Bounce rate > 85–90%, AND
- CR not significantly higher than other traffic → strong candidate for blocking.
- IP / UA rule:
- >20–30% of clicks from data-center IPs, OR
- >50% of traffic from the same user-agent → source should be treated as high-risk.
7.3. Filters and rules on the advertiser side
You can apply extra protection on top of the network’s anti-fraud layers:
- Blacklists:
- Block placements / sources that consistently show fraud patterns
- Block suspicious IPs / subnets (if you log them)
- Caps and limits:
- Limit daily volume from new sources (e.g. ≤5–10% of your total budget per new partner)
- Increase caps only for sources that show stable quality
- Targeting restrictions:
- Exclude regions, device types, or OS versions with high fraud share
- Turn off formats that are known to be risky for your vertical (e.g., certain redirect traffic)
- Protect your forms / apps:
- Basic CAPTCHAs (where UX allows it)
- “Honeypot” hidden fields that only bots will fill
- Server-side validation of data
- Phone or email confirmation for high-risk flows
7.4. Working together with the network
Anti-fraud works best when the advertiser and the network act like partners, not enemies.
- Start new sources and partners with test budgets and strict caps
- Agree on quality KPIs upfront:
- Minimum approval rate
- Accepted fraud level and how to handle chargebacks
- Share analytics regularly:
- Which leads were rejected and why
- Which sources had high fraud and low LTV
8. How a Typical Ad Network Anti-Fraud System Works

Every network has its own implementation, but the architecture is usually similar.
8.1. Data collection and enrichment
The network collects:
- Impression and click logs:
- Time, IP, user-agent, placement, site/app ID
- Conversion logs:
- Click ID, time, event type
- Additional signals:
- Referrer, cookies / device ID, fingerprint, geo, connection type
Then the data gets enriched with:
- Geo detection by IP
- IP type (residential / data center / proxy / VPN)
- Normalized user-agent (device model, OS, browser version)
8.2. Rule-based layer and risk scoring
On the first layer, there are hard rules such as:
- Too many clicks / conversions from one IP or device in a short window
- Clicks / impressions from blacklisted or high-risk IP ranges
- Abrupt spikes in CTR or CR on a single placement
- Instant conversions with obviously impossible TTC
Some traffic is rejected outright. For the rest, the system assigns a risk score: the more suspicious factors, the higher the risk.
8.3. Machine learning layer
Above the rules, networks often run ML models trained on labeled data:
- Rejected / chargeback conversions
- Known fraud campaigns
- Advertiser feedback on lead quality
The model looks at dozens or hundreds of features:
- Time-based patterns
- IP / device behavior
- Combinations of geo, device, TTC, CTR / CR, and more
Its goal is to estimate the probability that a specific click / lead / install is fraudulent.
8.4. Actions the system can take
Depending on settings and contracts with advertisers, the system may:
- Block events (not show them in stats, not bill them)
- Flag them as risky (e.g. separate them in reports)
- Put on hold until the advertiser sends final statuses
No system is perfect. Networks must balance between:
- Blocking as much fraud as possible
- Not killing legitimate but “weird-looking” traffic
This is why your feedback as an advertiser (approved / rejected conversions, reasons, LTV, retention) is crucial.
9. Advertiser’s Anti-Fraud Checklist (With Practical Thresholds)
Before launching a campaign
- Set up tracking with:
- UTMs, click IDs, subIDs for sources and placements
- Define which conversion statuses and quality signals you can pass back (approve, reject, reasons, down-funnel events)
- Agree with the network on:
- Quality KPIs (approval rate, acceptable fraud level)
- How chargebacks and fraud disputes are handled
During the campaign
- Monitor regularly:
- CTR, CR, eCPC, eCPA per source / placement
- Behavior: time on site, pages per session, bounce rate
- Time-to-conversion distribution per source
- Apply numeric rules:
- Stop or cap placements where:
- CTR > 3× median and CR < 0.5× median
- or eCPA > 1.5–2× median
- Flag sources where:
- Median TTC < 0.2× normal median for a complex offer
- and ≥20–30% conversions have TTC ≤ 5 seconds
- Consider blocking sources where:
- Average time on site < 3 seconds
- and bounce rate > 85–90%
- Treat as high-risk:
- Sources with >20–30% data-center IPs or >50% identical user-agent traffic
- Stop or cap placements where:
After the campaign
- Review performance:
- Which sources brought the best LTV / approval rate
- Which showed stable fraud patterns
- Send detailed feedback to the network:
- Lists of rejected leads with reasons
- Notes on suspicious sources / placements and why
Conclusion
Anti-fraud is not a magic button inside the ad network. It’s a joint process:
- The network tracks technical and behavioral anomalies on its side
- The advertiser tracks business metrics and user quality on their side
- Both exchange data continuously
The better you as an advertiser understand which signals in your stats may indicate fraud, and the more you formalize them with simple formulas and thresholds, the faster you can cut bad traffic, protect your budget, and help the network’s anti-fraud system learn what “quality” means for your business.