When performance “drops,” it’s often not the creative or the bids—it’s the traffic mix: which countries your audience comes from and which channels bring them. Let’s unpack how geo quality and traffic source push CPM and ARPU up or down, which metrics to watch, and how to manage the mix for margin, not mirages.
Core formulas (one screen)
- CPM (Cost per Mille) = (ad spend / impressions) × 1000
- ARPU (Average Revenue per User) = revenue / unique users
- eCPM (for monetizing media) = (revenue / impressions) × 1000
- rCPM (revenue CPM) = eCPM × viewability × valid rate
- LTV (t-day) = ∑ ARPU(day 0..t)
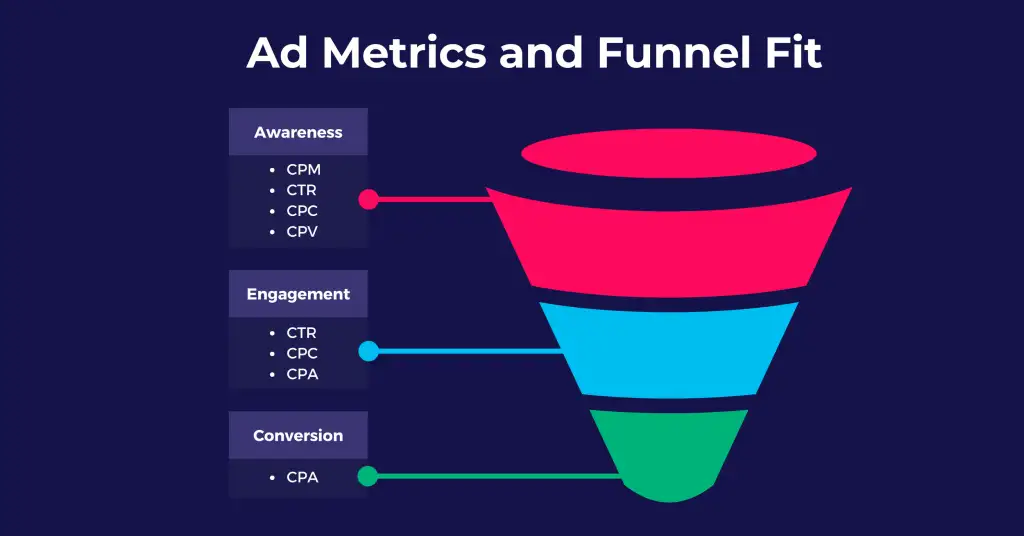
In acquisition you care about CPM (what you pay for 1,000 impressions); in monetization—eCPM/rCPM (what you earn per 1,000). Product teams focus on ARPU/LTV.
Why geography matters
1) Purchasing power & taxes
- Tier-1 (US/CA/UK/DE/FR/Nordics): high CPM due to auction competition and strong monetization (ARPU↑).
- Tier-2/3: lower CPM, but ARPU usually lower; “cheap installs” often evaporate at the LTV stage.
2) Infrastructure & inventory quality
Network speed, share of premium placements, in-app vs. web—all affect viewability, IVT (invalid traffic), and fill rate → eCPM/ARPU.
3) Law & privacy
GDPR/DSA/ATT/consent rate: the fewer targeting signals, the noisier the auctions → CPM↑ and ARPU↓ (less precise targeting).
Takeaway: The “same” source across different countries is effectively a different product. Normalize budgets and KPIs at the geo level.
Why source matters just as much
Channel mechanics
- Search/intent (brand, PLAs): “hot” demand—often CPM↑, but ARPU/LTV↑↑.
- Social/feed: depends on signal stack and optimization quality; highly sensitive to creative and frequency.
- Programmatic/RTB: broad reach, wide site quality spread; brand safety, viewability, IVT filters are critical.
- Influencer/UGC: CPM is less meaningful; track CPE/CPA and the after-effect on branded traffic → ARPU rises indirectly.
Attribution & cannibalization
Upper-funnel sources can lift ARPU via incremental visits yet “steal” credit from brand channels. Use experiments (geo-split, PSA tests), MMM, and incremental lift, not just MTA credits.
Exactly how geo & source move CPM and ARPU
| Factor | Impact on CPM | Impact on ARPU | What to do |
|---|---|---|---|
| Auction competition (Tier-1) | ↑ | ↑↑ (more affluent; higher conversion) | Keep if profitable on rCAC/LTV |
| Low viewability | ↓ nominally, but worse rCPM | ↓ (fewer real contacts) | Filter by viewability; optimize formats/placement |
| IVT/bot traffic | Can appear low | Zero or negative contribution | Add IVT vendor; cut sources |
| Intent sources | ↑ | ↑↑ | Scale; expand semantics/feeds |
| Broad-reach sources | ↕ | ↕ (creative & frequency dependent) | Strict frequency control; creative segmentation |
| Privacy constraints | ↑ (less precise targeting) | ↓ | Lean on context & first-party signals |
ARPU breakdown: where money leaks
ARPU = (DAU × CRpay × AOV × purchase frequency) / Users
- Geo effect: CRpay and AOV vary by country (3–5×).
- Source effect: first purchases depend on channel intent; retention depends on how truthful the creative’s promise is.
Practice: build cohorts (geo × source × week of acquisition) and track D1/D7/D30 ARPU, not averages.
Profit model per 1,000 impressions (quick check)
Profit per 1,000 imps = (ARPUper 1000 − CPM)
Where ARPUper 1000 = (click-through × conversion × AOV) × 1000 / usersper 1000 imps
For apps: simply eCPM (monetization) − CPM (buying).
If Profit/1000 < 0 in a specific (geo, source), cut that segment or change creative/landing.
Diagnostics: ask in this order
- Slices: CPM and ARPU by geo, source, placement, device, new/returning.
- Inventory quality: viewability, valid rate (IVT), brand safety.
- Cohorts: D0/D1/D7/D30 ARPU and retention for new users.
- Frequency & creative: frequency curves (frequency → CPA/ARPU), creative fatigue.
- Incrementality: geo-split/PSA tests for disputed sources.
Managing the mix: practical tactics
1) Bids & frequency by geo
- Separate bid caps and frequency caps by tier.
- For Tier-1: be willing to pay more only with proven ARPU/LTV lift.
- For Tier-2/3: lean into context/creative, not just bids.
2) Source quality control
- SLA: viewability ≥ 65–70%, IVT ≤ 1–2%, allowlists.
- Deduplicate frequency at the cross-channel level (not just within one DSP).
3) Creative & localization
- Localize price/offer/payment flows by geo; A/B cultural patterns.
- For intent channels, feed quality beats a “diamond” banner.
4) Attribution & tests
- Weekly geo-split on 1–2 “grey” sources.
- Holdout 10% on branded queries to gauge cannibalization.
30-day mini-plan
Weeks 1–2 (Audit)
- Break all key metrics by geo × source.
- Check viewability/IVT and draft two lists: “cut” and “scale.”
- Launch 2 geo-split tests for ambiguous sources.
Week 3 (Optimization)
- Reallocate budget toward (geo, source) with Profit/1000 > 0.
- Enable frequency caps by country and source.
- Refresh creatives for top geos (localization, offers, payments).
Week 4 (Scale & control)
- Expand semantics/placements in “green” combos.
- Lock monitoring: dashboard “CPM & ARPU by geo×source” + IVT/viewability alerts.
Dashboard metrics & thresholds
- Spend, Impressions, CPM
- ARPU D0/D7/D30, LTV (by cohorts)
- Viewability, IVT, Brand-safety flags
- Frequency → CPA/ARPU (diminishing returns curves)
- Incremental lift (where tests exist)
Rule: budget decisions are made only on geo × source slices and on a horizon no shorter than D7 ARPU (D3 is okay for very short monetization cycles).
Common mistakes
- Comparing CPM “on average” without geo context.
- Judging sources by CPA/ROAS without incrementality.
- Chasing cheap Tier-3 installs without LTV math.
- Ignoring viewability/IVT: “cheap CPM” often = “empty impressions.”
- Hammering the same segment without frequency control and creative refresh.
Bottom line
Geography and traffic source are the main levers of your ad economics.
- Geo sets the ceiling for CPM and the potential for ARPU via purchasing power, inventory quality, and privacy regimes.
- Source defines intent and the validity of contact.
The winners rebalance the mix regularly: cut zero-value (geo, source) pairs, localize offers, enforce quality controls, and prove contribution with experiments. That’s how budget growth multiplies—not dilutes—your profit per 1,000 impressions.
Conclusion
Our analysis highlights a clear correlation between geo-quality, traffic source, and their direct impact on CPM (Cost Per Mille) and ARPU (Average Revenue Per User). Key takeaways include:
- Geo-Quality Matters:
- Premium geographies (e.g., North America, Western Europe) consistently yield higher CPMs and ARPU due to stronger purchasing power and advertiser demand.
- Emerging markets show lower CPM but can still provide high volume traffic for broader monetization strategies.
- Traffic Source Influences Monetization:
- Direct/Organic traffic tends to deliver higher ARPU because of better engagement and user retention.
- Paid/social traffic can increase volume but often comes with lower CPM unless highly targeted.
- Combined Effect:
- The highest monetization occurs when high-quality geos are paired with direct or organic traffic.
- Conversely, low-quality geos and untargeted paid traffic can dilute revenue potential, even if volumes are high.
- Strategic Recommendations:
- Focus on geography-targeted campaigns to maximize CPM and ARPU.
- Optimize traffic sources, prioritizing organic/direct channels for high-value geos.
- Use low-geo-quality and low-ARPU traffic for scale campaigns, but manage expectations regarding revenue efficiency.
| Geo-Quality | Traffic Source | Typical CPM ($) | Typical ARPU ($) | Notes |
|---|---|---|---|---|
| High (US, EU) | Direct/Organic | 5–15 | 1.5–5 | Premium traffic; highest monetization potential |
| High (US, EU) | Paid/Social | 3–10 | 1–3 | Lower engagement than organic, but scalable |
| Mid (LATAM, SEA) | Direct/Organic | 1–5 | 0.5–2 | Moderate revenue; good engagement if targeted |
| Mid (LATAM, SEA) | Paid/Social | 0.5–3 | 0.2–1 | Large volumes possible but lower efficiency |
| Low (Africa, ME) | Direct/Organic | 0.5–2 | 0.1–0.5 | Limited monetization; niche opportunities |
| Low (Africa, ME) | Paid/Social | 0.2–1 | 0.05–0.2 | Highest risk/lowest yield; use mainly for scaling |
FAQ
1. Why does GEO quality affect CPM and ARPU?
GEO quality impacts how valuable your audience is to advertisers. Tier-1 countries usually have higher purchasing power and better conversion rates, which results in higher CPM and ARPU.
2. How do traffic sources influence CPM?
Different sources provide different user intent levels. Direct and organic traffic typically deliver higher engagement and thus higher CPM, while low-intent traffic from incentivized or cheap sources often lowers CPM.
3. What traffic types are considered “high quality”?
High-quality traffic includes direct, organic, social, and search traffic. These users are more engaged and produce better conversion metrics for advertisers.
4. Can mixed traffic from various GEOs reduce my overall ARPU?
Yes. If your high-tier traffic is diluted with low-tier or low-intent traffic, advertisers may reduce bids, lowering your ARPU and effective CPM.
5. How can publishers increase CPM and ARPU?
Improve traffic quality, focus on Tier-1 GEOs, reduce bot/invalid traffic, optimize placements for user engagement, and partner with premium ad networks.